


Business intelligence is the cornerstone of innovation, efficiency, and competitive advantage. Our team of experts in data science, processing, and management works alongside yours to organize your data and create a single source of truth.
Through our strategic partnership with Microsoft, we unlock unparalleled data value for our clients. This collaboration ensures you have immediate access to precise, actionable insights—empowering you to make faster, smarter, and more confident data-driven decisions.
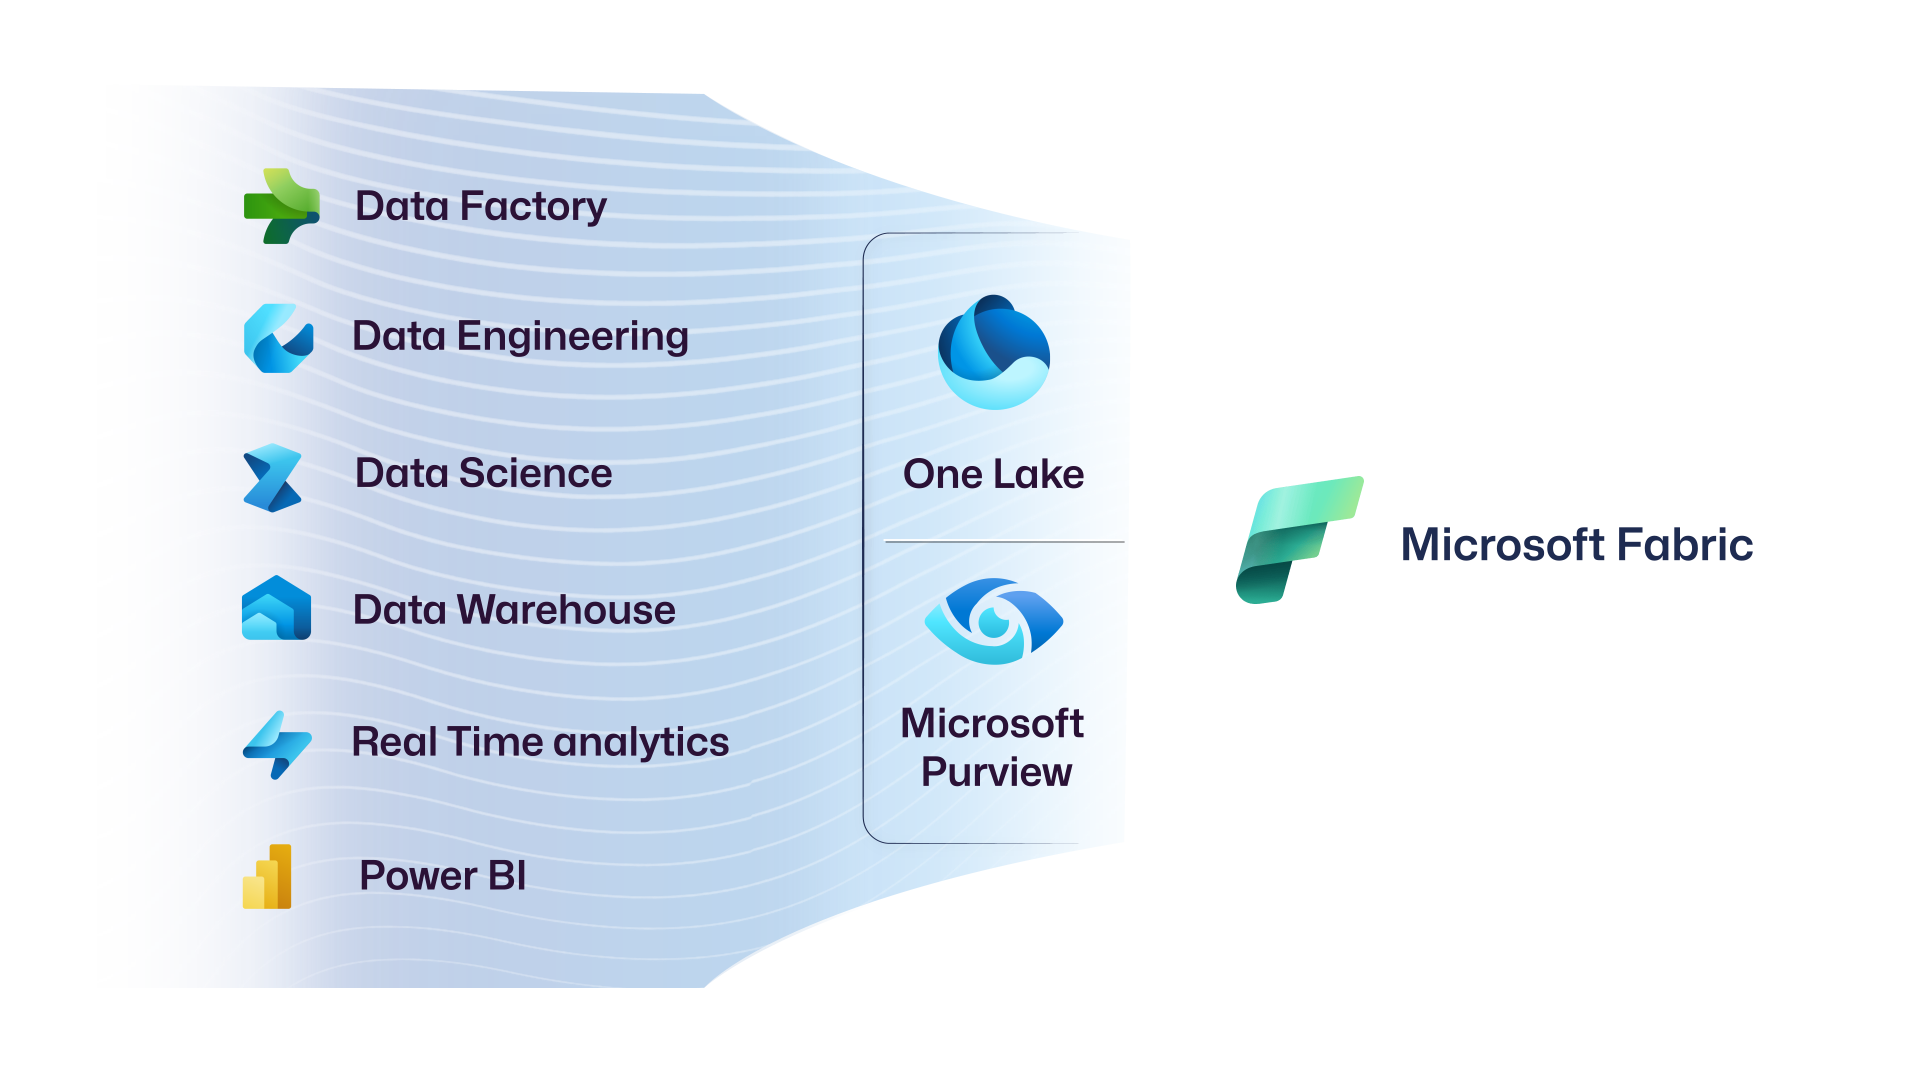
Microsoft Fabric: the way forward
TMotions is your trusted partner for harnessing the power of Microsoft Fabric. We help organizations across every industry manage their data through a unified foundation that spans multiple public and private clouds, establishing a single source of truth for all your information. Built on an open, lakehouse-centric framework with integrated data governance, Microsoft Fabric allows you to access insights with confidence and trust.
As a SaaS solution, Microsoft Fabric lets enterprises quickly adopt and deploy it to solve real business challenges and maximize the value of their data. At TMotions, we ensure that this process is seamless, enabling you to leverage your existing investments in data tools—be it Azure Databricks, Snowflake, Azure Data Factory, Azure Synapse Analytics, or Power BI—without the need for an expensive rip-and-replace approach.

Real-Time Intelligence
Fabric’s Real-Time Intelligence service empowers your organization to extract actionable insights and visualize data in motion. It delivers an end-to-end solution for event-driven scenarios, streaming data, and data logs—ensuring that whether you’re handling gigabytes or petabytes, your data converges seamlessly in the Real-Time Hub.
At TMotions, we excel at leveraging this powerful Fabric service. Our deep expertise ensures that every aspect of Real-Time Intelligence—from data ingestion and transformation to storage, analytics, visualization, AI integration, and real-time actions—is optimized to drive business value.
Microsoft Power BI
Power BI enabled services for Enterprises to build real-time dashboards and generate real-time actionable insights.
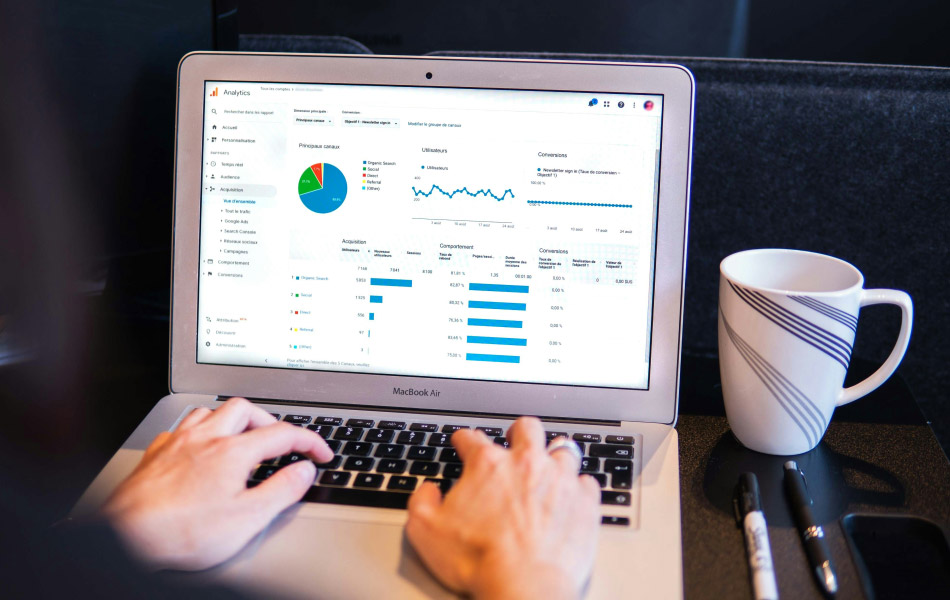
Dashboarding & Visualization
As data is gathered in facts and figures in raw form and from various channels, it is not ready to be consumed. Power BI helps businesses with data ingestion and optimize performance whilst data-driven decisions help identify more efficient ways of doing business.
Developing tailored dashboard solutions which are scalable, intuitive, and support Enterprises to execute business decisions in real-time.
Our business intelligence solution helps you to depict a story in form of immersive, interactive graphs and charts, matrix, scatter plots and heat maps.